In-Store Display ROI: How to Tell If Your POS Program Is Working
Key takeaways
- Most display programs cannot prove ROI because nobody verified the displays were set and nobody established a baseline before the program shipped.
- Industry audits routinely find that a third or more of ordered displays never get built, get built late, or get built wrong — so measure placement before you measure sales.
- The measurement stack is three layers: time-stamped photo verification, sell-through in display stores versus matched control stores, and incremental lift net of cannibalization.
- Location, shoppability, and language fit usually move display performance more than the artwork does.
- A workable ROI model: incremental units x weeks x verified stores x margin, against the fully loaded cost of production, freight, fees, and field labor.
Every display program has a moment of truth, and it is not the sales meeting where the retailer approved it. It is three weeks later, when someone asks whether the displays actually sold anything and the room goes quiet.
That silence is common, and it is fixable. Measuring POS display effectiveness does not require sophisticated software. It requires proof the display was set, a baseline to compare against, and some discipline about counting the full cost. This guide covers all three.
Why Most Display Programs Can't Prove ROI
Most display programs cannot prove ROI for two reasons: nobody verified the displays were actually set, and nobody established a sales baseline before the program shipped. Without those two facts, every number that follows is a guess.
The typical pattern looks like this. A brand produces a few hundred displays, ships them to distribution centers or direct to stores, and watches total sales during the promotion window. If sales went up, the display gets the credit. If they did not, the creative gets the blame.
Both conclusions are unreliable. Total sales move for reasons that have nothing to do with the display: pricing, seasonality, a competitor's promotion, even weather. And if a large share of the displays never made it out of the back room, you are grading a program that mostly did not happen.
The Placement-Compliance Problem
A meaningful share of the displays brands pay for never get set. Industry audits routinely find that roughly a third to nearly half of ordered displays are never built, are built late, or are built incorrectly. Brands that assume compliance near 80 or 90 percent usually measure something closer to 40 to 60 percent once they start checking stores.
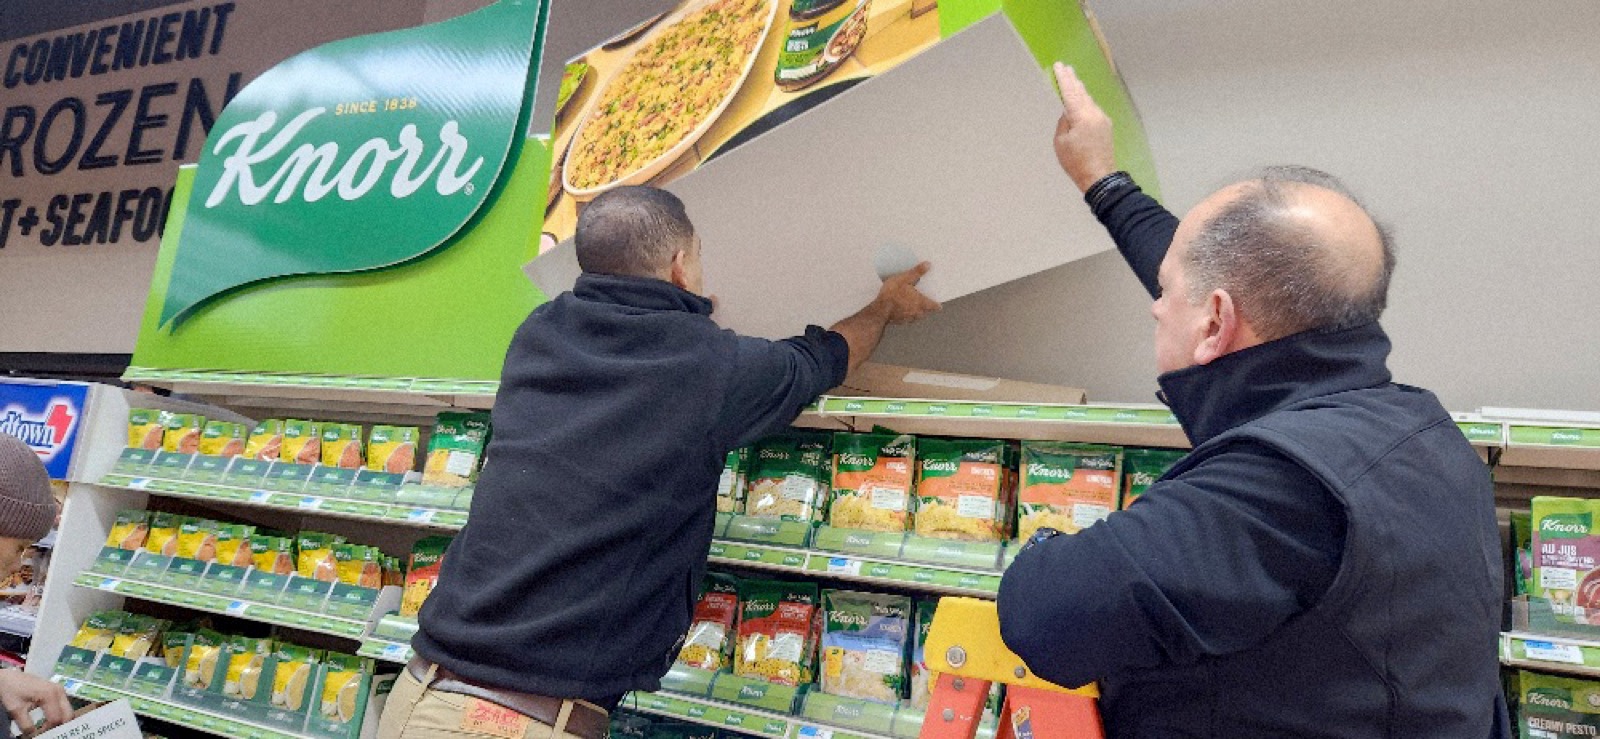
The reasons are mundane. Displays arrive damaged or missing parts. Store staff have no time to build them, so the corrugate sits flat in the back room until the promotional window closes. A manager sets the unit in a dead corner just to clear the receiving dock. None of this shows up in shipment data — the display shipped either way.
This is why placement verification comes before any sales math. If half your displays were never set, your real per-store performance is roughly double what the blended numbers suggest — and your problem is execution, not creative.
The Measurement Stack: Verify, Compare, Isolate
A workable measurement stack has three layers: time-stamped photo verification that the display was set, store-level sell-through compared against matched control stores, and incremental lift calculated net of what the display took from your own shelf sales.
- Photo verification: a field rep photographs each display, time-stamped and store-tagged, within the first days of the window. This gives you a true set rate and a list of stores to chase.
- Control-store comparison: match display stores to similar non-display stores — same banner, similar volume, same market — and compare weekly movement. The difference is the display's effect, not the season's.
- Incremental lift: subtract cannibalization. If display sales came out of your own shelf facings, the display shifted units instead of adding them. Category-level movement in the same stores tells you which one happened.
Design Factors That Change Display Performance
Where a display sits, how easily shoppers can pull product off it, and whether it speaks the store's language usually move performance more than the artwork does. Three factors deserve attention before the design file is even opened.
- Location in store: a unit on a power aisle or near the front end can outperform the same unit parked by the restrooms several times over. Negotiate location as part of the placement, and have your field team report where each unit actually landed.
- Shoppability: displays that arrive pre-packed, hold enough product to survive a weekend, and let shoppers grab items without wrecking the presentation get restocked and stay up. Fussy displays are the first ones store staff pull.
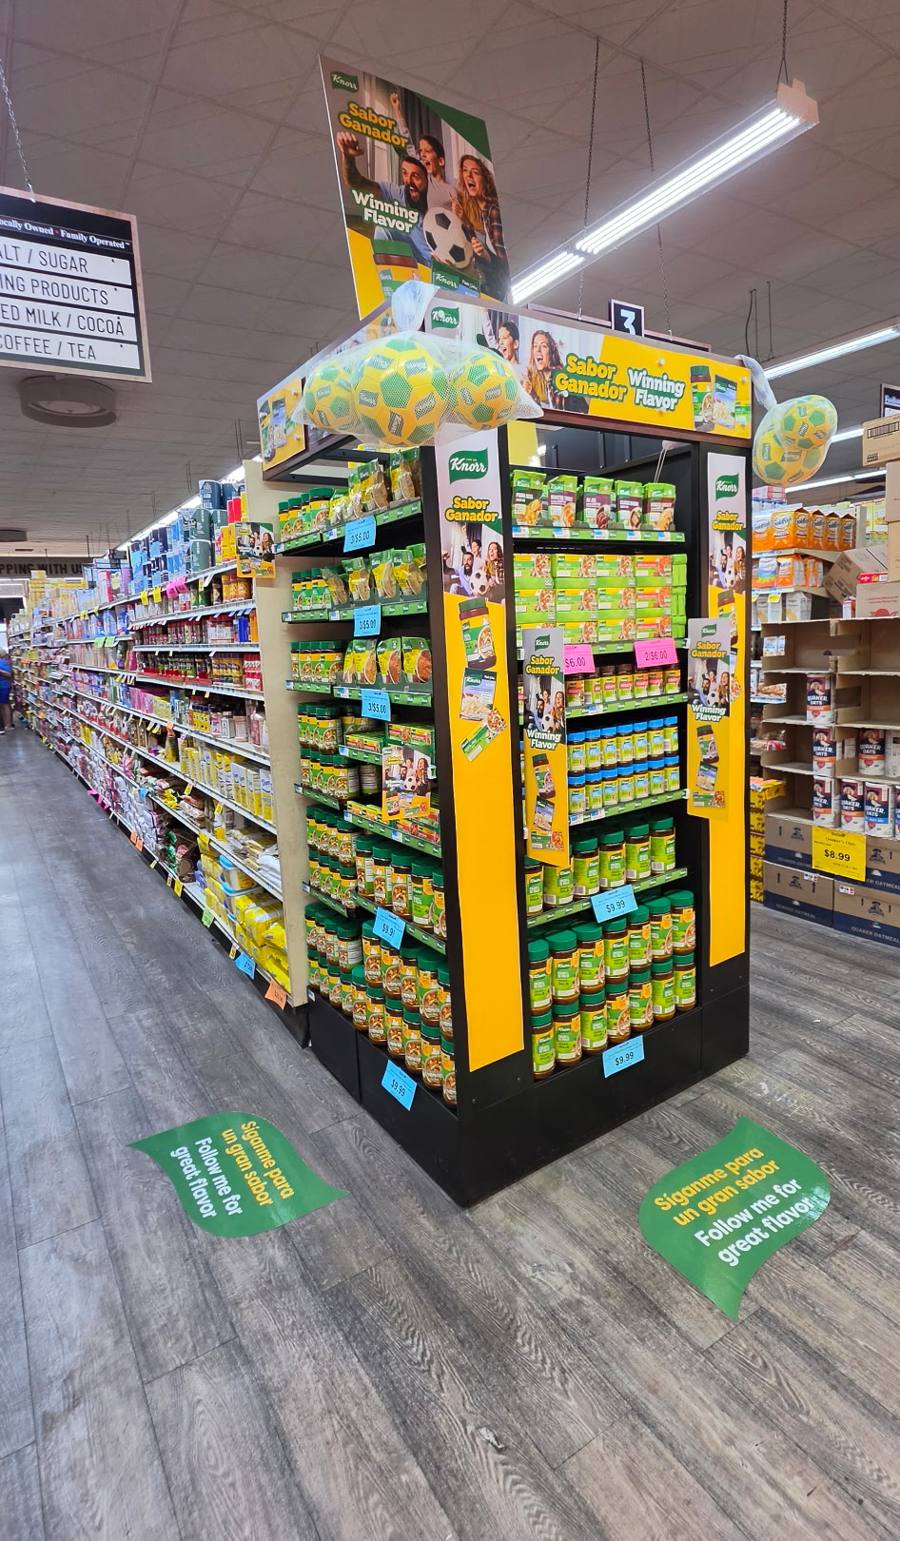
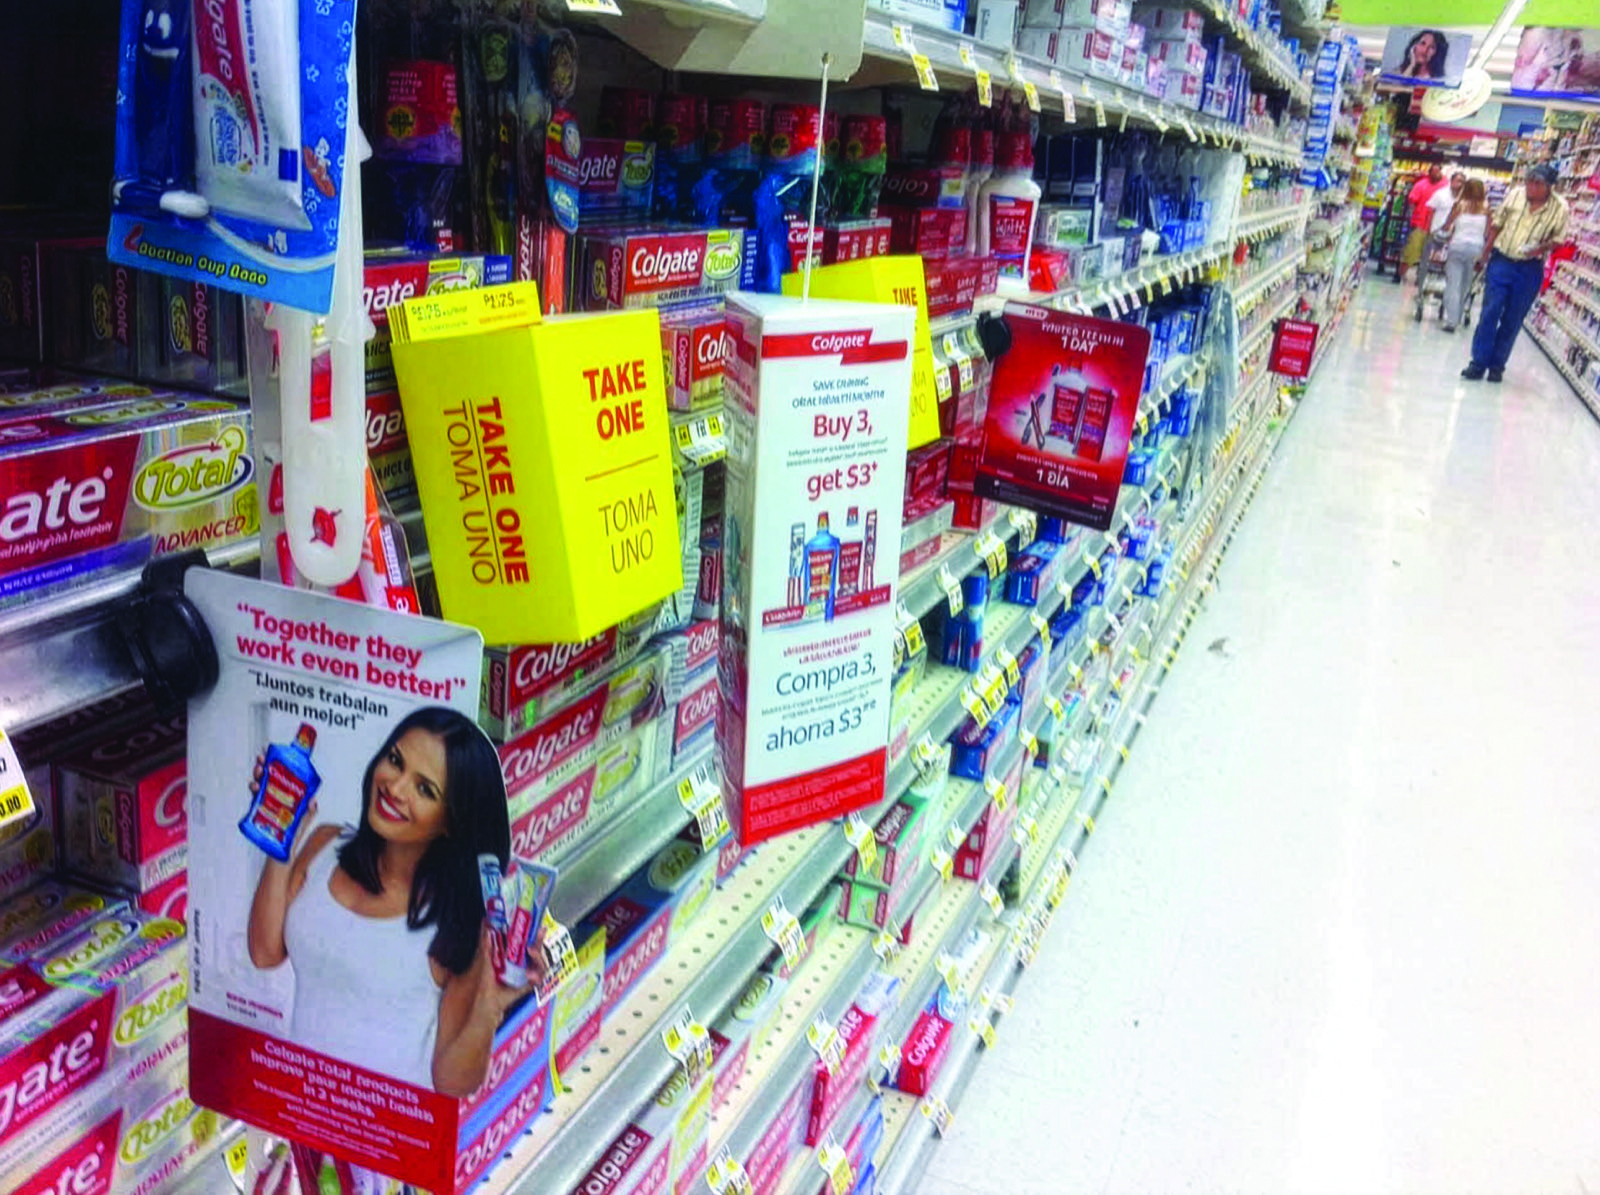
- Language fit: in stores serving Hispanic neighborhoods, bilingual or Spanish-first messaging is a performance variable, not a translation chore. We see it constantly in the NY/NJ independent grocery channel — the same offer performs differently depending on whether the shopper can read it at all.
When to Reset a Program — and When to Pull It
Reset when the placement failed; pull when verified displays still do not sell. Those are different failures with different fixes, and photo data is what tells them apart.
If verification shows a low set rate, the program did not fail — it never ran. The fix is a reset wave: field teams revisit the non-compliant stores, build the units, and recover the remaining weeks of the window. Corrugate in the back room still has value if someone goes and gets it.
If set rates are healthy and lift in verified stores is still flat after two to three weeks, that is a real signal. Stop the program at the next decision point and put the remaining trade dollars behind whatever is working. Running a proven-flat display for the calendar's sake is the most avoidable waste in trade spend.
A Simple Display ROI Model You Can Copy
The model is one line: incremental units per store per week x weeks x verified stores x margin per unit, set against the fully loaded program cost. Every input comes from the measurement stack above — no input should come from an assumption.
- Incremental units: display-store movement minus control-store movement, per store per week, net of cannibalization.
- Verified stores: count only stores with photo-confirmed placement. Using ordered or shipped counts inflates the denominator and hides execution problems inside an average.
- Fully loaded cost: structure and design, printing and production, freight, retailer program fees, and the field labor to set and maintain the units. Production alone is usually the smaller half of the bill.
Run the math at the store level, not just the program level. A program that loses money on average often contains a group of stores where it clearly works — and next time you buy half the units and put all of them in stores like those.
This is the loop we run at HAP: we produce POS displays in-house, place them with our own field teams, photograph every set, and report store-level conditions back so the sell-through math has something honest underneath it. Since 1996, the pattern has held — the brands that measure placement first are the ones whose display budgets keep getting approved.
Frequently asked questions
How do you measure POS display effectiveness?
Verify placement first with time-stamped photos, then compare sell-through in display stores against matched control stores over the same weeks. The difference, net of cannibalization from your own shelf sales, is the display's incremental lift. Multiply that by verified stores and margin per unit, then set it against the fully loaded program cost.
What percentage of retail displays actually get set up?
Industry audits vary, but they consistently find a large share of ordered displays never get built — commonly a third or more once late and incorrect sets are included. Brands that assume compliance near 80 or 90 percent typically measure something closer to 40 to 60 percent when they start photographing stores.
How long should an in-store display program run?
Most promotional displays run two to eight weeks, tied to the retailer's promotional calendar. The checkpoint matters more than the length: verify placement in week one, read lift by week two or three, then decide whether to extend, reset non-compliant stores, or pull the program and redeploy the spend.
What makes a retail display effective?
Placement, shoppability, and message fit. A display in a high-traffic location, stocked deep enough to survive a weekend, easy to shop without wrecking the presentation, and written in the language the store's shoppers actually read will outperform prettier units that miss those basics. The artwork matters, but only after those three are handled.